Data Brick Space Mission: Using LEGO to Explore the World of Data
Why Data Feels Dull — and How to Fix It
For many children, the word “data” sparks confusion, boredom, or even anxiety. Charts, numbers, and terms like “analysis” or “statistics” can feel disconnected from the imaginative world kids naturally thrive in. As we champion STEM learning, we often overlook how to make data not only understandable but also thrilling.
What if data wasn’t just about spreadsheets, but about building spaceships? What if kids could touch and reshape the information they’re learning about? That’s where LEGO—already beloved by kids—comes in as a powerful gateway.
Learning Through Building: A Tactile Approach to Data Concepts
This activity series blends tactile play with core data literacy skills:
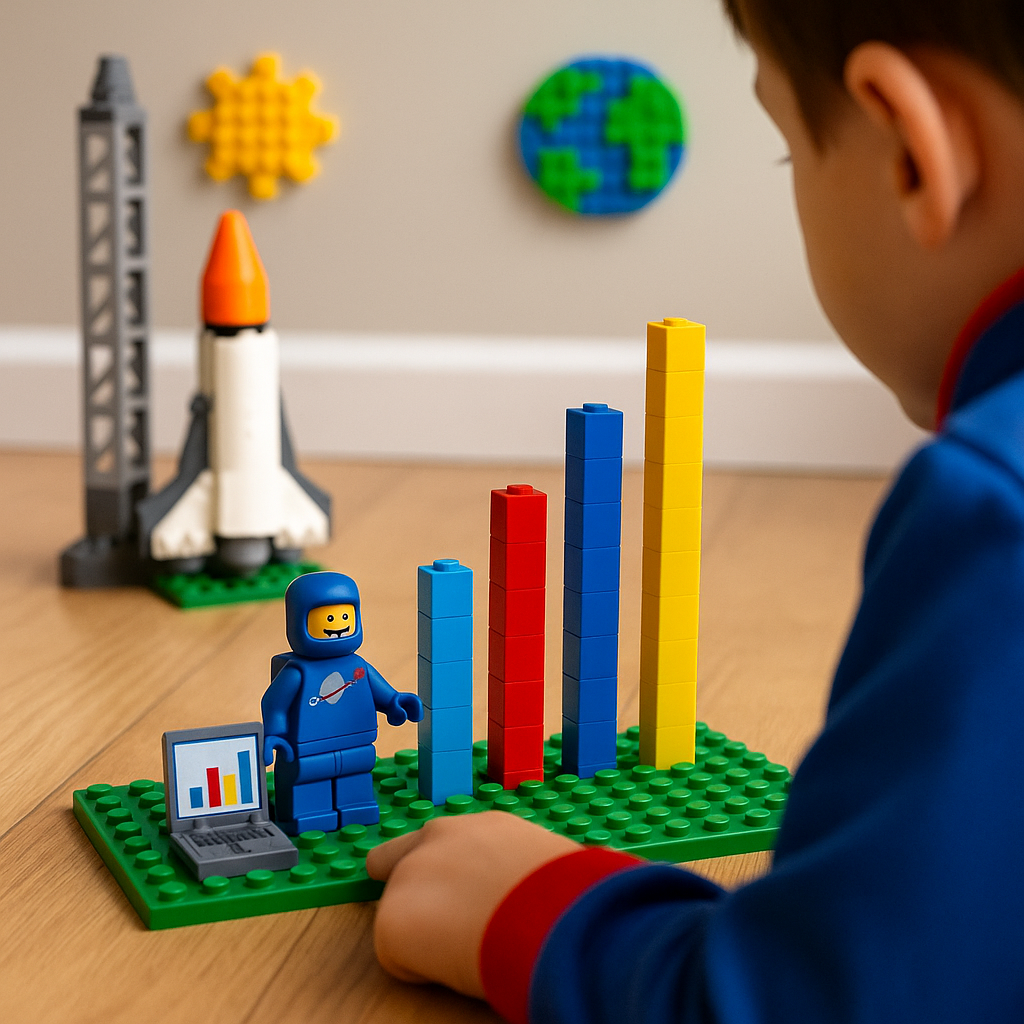
- Concrete Visualization: Kids collect information and physically construct graphs using LEGO bricks of different colours or heights.
- Hands-on Discovery: Instead of abstract math, data becomes something they build and manipulate.
- Storytelling with Structures: LEGO scenes allow children to create stories from what the data reveals (e.g. rocket fuel levels, mission outcomes, alien weather).
- Balancing Creativity and Logic: Inspires imaginative play while reinforcing structured thinking.
This method aligns with our Math Games That Move and Story-Based STEM Challenges. By combining narrative, motion, and tangible tools, data becomes far less intimidating—and a lot more engaging.
Mission Guide: LEGO-Based Data Projects
(Each project includes estimated time & difficulty)
1. Rocket Launch Tracker
Time: 30 min | Level: Easy
Log 10 pretend launches. Use LEGO bricks to build a vertical graph showing how high each “rocket” flew (e.g. red = 10 bricks = high flight, blue = 3 = failed launch).
2. Alien Life Survey
Time: 45 min | Level: Medium
Survey family or classmates: Which alien snack is best? Build bar charts to display results. Transform each column into part of an alien habitat.
3. Oxygen Supply Countdown
Time: 30 min | Level: Easy
Assemble a LEGO oxygen tank using blocks. Remove one brick per completed task. A fun and visual countdown system for productivity.
4. Build-a-Graph Galaxy
Time: 60 min | Level: Medium
Use a LEGO baseplate to lay out a data universe. Each row = a planet, each column = number of missions. Useful for comparing categories.
5. Weather Watch Space Dome
Time: 45 min | Level: Medium
Track daily weather (real or imagined interstellar weather). Use clear or blue bricks for clouds, yellow for sun, white for snow. Construct a dome that visualises your log.
6. Mission Control Board
Time: 30 min | Level: Easy
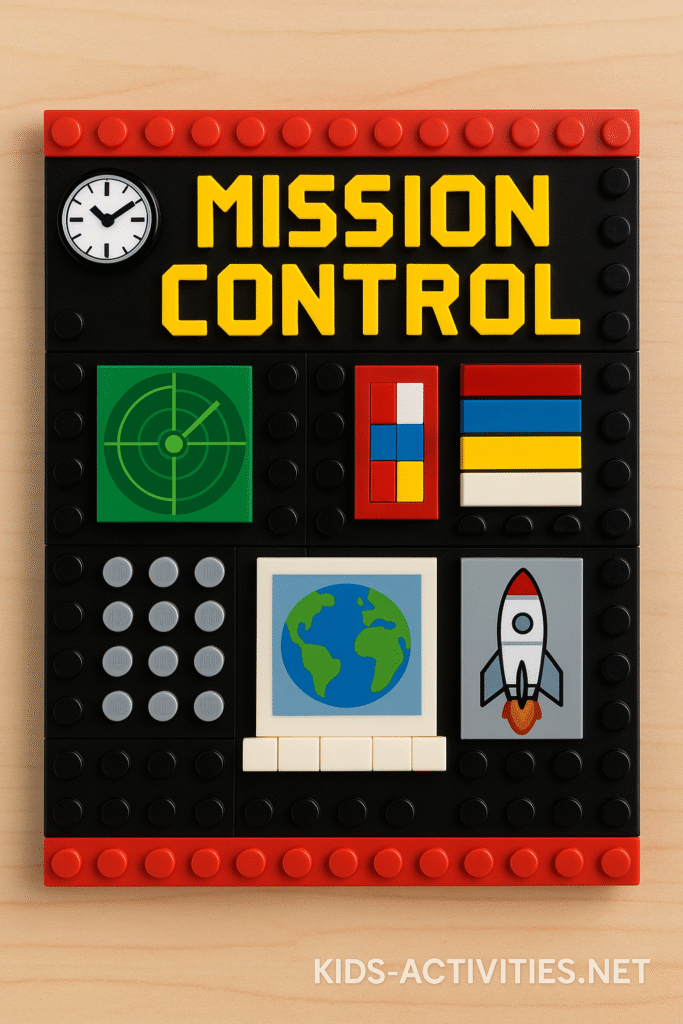
Create a LEGO board where each brick stands for a completed system or task (e.g. navigation, comms, safety checks). Perfect for classroom use.
What Parents and Teachers Are Saying
“Our son never liked bar charts—until we built them with LEGO. Now he invents his own data sets!” — Alex, SA
“We tracked family chores using the oxygen brick timer. It turned routines into challenges.” — Priya, NSW
“My class competes to build the coolest mission chart—and they don’t even realise they’re doing stats.” — Mr. Grey, Year 3 teacher
Further Exploration
Try our Printable LEGO Graph Templates to extend your learning.
Visit our STEM Learning Archive for more hands-on science.
Browse our Story-Based Challenges for creative twists.
Supplies & Extras
- LEGO bricks in various colours
- Baseplate or flat build surface
- Printable Graph Sheet (optional)
- Task tracker or survey ideas
- Timer or stopwatch (optional)
Download the Space Mission Data Kit (PDF)
Closing Thought: From Numbers to Narratives
With just a bucket of LEGO and a spark of creativity, data transforms from dry numbers into exciting missions. These projects weave together storytelling, numbers, and spatial thinking into things kids can build, revise, and proudly share. It’s not about memorising—it’s about making sense of information through play.
Next time your kids groan at a chart, hand them bricks instead.


